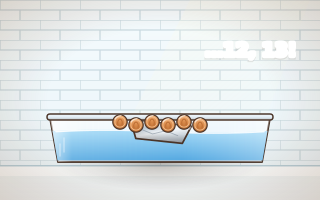
Which boat shape carries the most pennies?
- 👶 Small parts
- 💧 Water
- 🧽 A bit messy
My hypothesis
If I change the shape of the boat, then how many pennies it carries before it sinks will ______, because ______.
You fill in the blanks. Think about how much water each boat pushes out of the way before water spills over its sides. A guess is a good because: the test finds out.
Change, measure, keep the same
CHANGE
the shape of the boat: Flat raft, Square box, Round bowl
MEASURE
how many pennies it carries before it sinks, in pennies
KEEP THE SAME
- the same size of foil
- adding pennies one at a time
- the same tub of water
Scientists call the thing you change the independent variable and the thing you measure the dependent variable. The things you keep the same are the controls: if one of them changed too, you wouldn't know which change made the difference. Try each of the 3 levels 3 times.
What you need
- Foil: 3 squares, 20 cm across
- Pennies: about 100
- A tub of water
- 📏 A ruler
Steps
- Tear three squares of foil, all 20 cm across.
- Fold one into a flat raft with its edges turned up a little.
- Fold one into a square box and one into a round bowl.
- Float the raft and add pennies one at a time.
- Count the pennies when water comes in, and write it down.
- Dry the foil, shape it again and test it two more times.
- Do three tests with the box and three with the bowl.
- Draw a bar for each boat. Which carried the most?
Every step is one you can do yourself, with a grown-up nearby. Write each number down straight away, in the table below, so nothing is lost.
Your results table
Name ______________________ Fair day ____________
Question: Which boat shape carries the most pennies?
I changed: Boat shape I measured: how many pennies it carries before it sinks (pennies)
| Boat shape | Try 1 (pennies) | Try 2 (pennies) | Try 3 (pennies) | Mean |
|---|---|---|---|---|
| Flat raft | ||||
| Square box | ||||
| Round bowl |
MY GRAPH (a bar graph: boat shape along the bottom, pennies up the side)
What I noticed: ______________________________________________
From 4th grade, add the tries for each level and divide by how many there were: that's the mean, and it goes in the last column. Then draw a bar graph, one bar for each thing you tried.
Name ______________________ Fair day ____________
Question: Which boat shape carries the most pennies?
If I change the shape of the boat, then how many pennies it carries before it sinks will ________________, because _____________________________________________
| I CHANGE | I MEASURE | I KEEP THE SAME |
|---|---|---|
| Boat shape: Flat raft, Square box, Round bowl | how many pennies it carries before it sinks (pennies) |
|
What I think will happen, in my own words:
Name ______________________ Fair day ____________
Question: Which boat shape carries the most pennies?
| Date | What I did | What I saw | What I think |
|---|---|---|---|
Name ______________________ Fair day ____________
Question: Which boat shape carries the most pennies?
| Date | What I did | What I saw | What I think |
|---|---|---|---|
Name ______________________ Fair day ____________
Question: Which boat shape carries the most pennies?
| Date | What I did | What I saw | What I think |
|---|---|---|---|
Name ______________________ Fair day ____________
Question: Which boat shape carries the most pennies?
My hypothesis was ☐ right ☐ partly right ☐ not right.
I know because my numbers show:
What surprised me, or what might have gone wrong (7th and up):
Next time I would test:
Idea: Change a second thing: make each shape with low sides and with high sides, and test all six.
Why it works
A boat floats when it pushes enough water out of the way to hold up its weight. Boats with higher sides can sink deeper before water spills in, so they push more water aside and hold more pennies. Spreading the pennies out helps too, because no corner dips under first.
Going further (7th and up): Change a second thing: make each shape with low sides and with high sides, and test all six.
Board layout
- ❓ Question (10 × 8 in): Which boat shape carries the most pennies?
- 💭 Hypothesis (10 × 9 in): If I change the shape of the boat, then how many pennies it carries before it sinks will ______, because ______.
- 🧺 Materials (10 × 12 in): 3 things: see your list.
- 🪜 Steps (22 × 9 in): 8 steps, three tries at each level.
- 📊 Results (22 × 16 in): Your table (Boat shape down the side, tries across) and your bar graph.
- ✅ Conclusion (10 × 14 in): My hypothesis was right / partly right / not right. I know because…
Materials to list: Foil; Pennies; A tub of water.
Bring photos or drawings of your test. Nothing wet, hot, powered or alive on the table.
This project at your grade
| 1st–3rd grade | Tries: three at each level (one is fine at a first fair). The table: levels and tries, numbers or pictures. The graph: a picture, or a simple bar graph. The conclusion: what happened, in their words. |
|---|---|
| 4th–6th grade | Tries: three at each level. The table: units in the header and a mean column. The graph: a bar graph, or a line for a number that grows. The conclusion: right, partly or not, and the numbers that show it. |
From 4th grade up, the table gets a mean column. See every project for 1st grade, or print a blank results table.
What a judge will ask
- What did you change, and what did you measure? I changed the shape of the boat and measured how many pennies it carries before it sinks, in pennies.
- What did you keep the same, and why does that matter? I kept the same size of foil and adding pennies one at a time the same, so the only difference was the shape of the boat.
- How many times did you test it? 3 times at each of my 3 levels.
- If you did it again, what would you change or test next? I'd make each shape with low sides and with high sides, and test all six.
Make it yours
Keep this project on this device and Peabody counts down to your fair day, with a plan for each day. Nothing is sent anywhere.
Try next
- How much salt does it take to float an egg?3rd–7th grade · 1 day of testing · free🧪 Water, ice and mixing · 🧂 Kitchen things
- Which paper bridge shape holds the most coins?2nd–7th grade · 1 day of testing · free🚗 How things move · ✂️ Paper, tape and toys
🔨 From the Workshop: this project grows from a Workshop build, with picture steps of its own.
👨👩👧 For grown-ups and teachers: how much to help, the safety rules, and running a school fair. Science fair v0.16.1 · Checked .